



Why commercial solar ROI cleaning deserves a seat at the finance table
Commercial solar arrays are a long-term capital investment. When panels accumulate dust, pollen, bird droppings, and industrial grime — a process called “soiling” — they produce less electricity. For commercial owners who monetize generation through on-site value, retail offsets, or PPA revenues, that lost generation is directly lost revenue and a hit to project IRR and payback time. The degree of impact varies strongly by location and tilt angle, but the financial effect is universal: lost kWh = lost dollars, and the numbers add up quickly on scale. NREL+1
Key Points
- Soiling reduces production, production reductions directly lower revenue.
- Financial impact depends on local soiling rates, system size, and electricity price.
- Location-specific data should guide cleaning decisions.
Sources: NREL Photovoltaic Module Soiling Map; IEA-PVPS report on soiling losses. NREL+1
How much generation is actually lost to soiling?
Peer-reviewed and institutional studies show wide variability. Global reviews estimate typical annual soiling losses around 3–4% on average, but arid and coastal desert sites can see annual losses well into the double digits — case studies have found single-site annual losses as high as 20–40% where deposition rates are high and rainfall infrequent. NREL’s soiling map quantifies site-level annual losses (expressed as an “insolation-weighted soiling ratio”); many U.S. sites in the Central Valley and Southwest routinely report multi-percent annual losses that justify targeted cleaning. Use local monitoring (soiling stations, comparative modules) to get the real number for your site. PMC+2Nature+2
Key Points
- Average global soiling ≈ 3–4% per year, but site results vary widely.
- Desert/coastal dust conditions can cause much higher annual losses.
- Measure local soiling — don’t rely on global averages for commercial decisions.
Sources: Review of soiling impacts; Nature study with field measurements; NREL soiling map. PMC+2Nature+2
Turning energy loss into dollars — a simple model
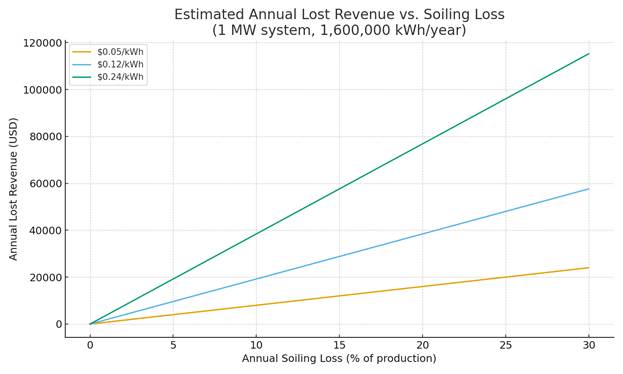
To make decisions we convert percent production loss into dollars. For a 1-MW commercial system assumed to produce 1,600,000 kWh/year, a 5% soiling loss equals 80,000 kWh lost. Multiply lost kWh by your retail/wholesale avoided cost (examples: $0.05/kWh, $0.12/kWh national commercial average, or higher regional rates like California’s ~$0.20–$0.30/kWh) to get annual lost revenue. The below chart shows lost revenue vs. soiling loss for those price scenarios; at 5% soiling a $0.12/kWh price corresponds to roughly $9,600/yr in lost revenue for the 1-MW example. (Assumptions are stated clearly in the chart — replace them with site-specific production and contract rates to run your own numbers.) National average commercial prices are available from the U.S. EIA; California and other high-price regions markedly increase the dollar impact per percent lost. U.S. Energy Information Administration+1
Key Points
- Convert lost % into kWh then into dollars using your local price/kWh.
- Lost revenue scales linearly with both soiling % and electricity price.
- High retail rates magnify the value of cleaning.
Sources: EIA commercial price tables; state-level price summaries. U.S. Energy Information Administration+1
Cleaning costs and how to think about ROI
Cleaning costs for large commercial/utility arrays vary by scale, water logistics, terrain, and access. NREL has used a rule-of-thumb example that a one-time cleaning for a 10-MW farm can be on the order of $5,000 (site-dependent), while commercial contractors commonly price by panel or by MW with ranges that depend on quantity and frequency. Industry published ranges (and surveys of O&M budgets) place annual cleaning/maintenance somewhere in the O&M budget envelope often quoted as a few tenths to a few dollars per kW-year depending on services included. That means cleaning costs are often small relative to the recovered revenue from even modest soiling losses — but the math is site-specific. Use measured soiling loss, your electricity price, and local cleaning quotes to compute payback and incremental IRR. NREL+2Soilar Technologies+2
Key Points
- Typical large-site one-time cleaning examples (NREL) are low relative to recovered revenue in high-soiling areas.
- Contractor rates scale down with volume; get quotes per MW or per panel.
- Put cleaning into O&M budget and compute payback vs. lost revenue.
Sources: NREL articles and O&M cost reports; industry cleaning price guides. NREL+2Soilar Technologies+2
Practical decision framework (data-driven)
- Measure: Install a soiling sensor or compare co-located cleaned vs. uncleaned test modules for 3–6 months to establish a site-specific annual loss curve.
- Price: Use your actual avoided cost / PPA rate to convert lost kWh to dollars.
- Cost: Collect 2–3 cleaning quotes (per MW or per panel) that include mobilization and water hauling if needed.
- Optimize frequency: If the annual lost revenue from soiling at your measured rate exceeds the annualized cost of cleaning (including any productivity downtime or safety costs), schedule cleaning at the economically optimal cadence; otherwise, defer. Studies recommend dynamic schedules: more frequent cleaning in spring/summer in dusty climates, less in rainy seasons. NREL Publications+1
Key Points
- Use measurement first; then compare lost revenue to cleaning cost.
- Dynamic, seasonally aware cleaning often beats fixed annual schedules.
- Include non-energy impacts (warranties, soiling-induced hotspots) in high-deposition environments.
Sources: NREL soiling extraction and variability studies; soiling seasonality analysis. NREL Publications+1
Example breakeven snapshot
Using the 1-MW / 1,600,000 kWh example: at $0.12/kWh, each 1% annual soiling loss costs $1,920/yr. If a quoted annualized cleaning program (multiple visits amortized) costs $6,000/yr, the cleaning breaks even at about 3.125% annual soiling loss. In high-price regions (e.g., $0.24/kWh), the break-even soiling rate halves. That quick back-of-envelope shows why cleaning often makes sense in the Southwest, Central Valley, and other high-soiling/high-price markets. (For accuracy on any project, replace the assumptions with metered system output and real contract prices.) U.S. Energy Information Administration+1
Key Points
- Breaking even depends on system yield, local price/kWh, and cleaning cost.
- Higher electricity prices and higher soiling rates make cleaning more attractive.
- Run a simple spreadsheet with your site numbers to decide.
Sources: EIA pricing and NREL example cleaning cost. U.S. Energy Information Administration+1
Bottom line and next steps
Dirty panels are not merely an operations nuisance — they are a quantifiable cost that reduces commercial solar ROI. The right approach is empirical: measure your site, get local cleaning quotes, and compare lost-revenue vs cleaning cost. In many commercial settings — especially in arid, dusty, or high-price electricity markets — regular professional cleaning is financially justified and can materially improve project-level IRR.
If you’d like a site-specific calculation (we can model your actual system size, measured yield, and contract prices), call us at 951-675-8181 or email service@greenfacilitycleaning.com. Visit greenfacilitycleaning.com for more about our commercial & utility solar cleaning services and to request a quote.